Easily profile your rust crate with Xcode Instruments.
cargo-instruments is the glue between Cargo and Xcode's bundled profiling
suite. It allows you to easily profile any binary in your crate, generating
files that can be viewed in the Instruments app.
This crate only works on macOS because it uses Instruments for profiling and creating the trace file. The benefit is that Instruments provides great templates and UI to explore the Profiling Trace.
To install Instruments, install Xcode from the App Store. (The Command Line Tools you might have already installed while setting up Rust are not sufficient.)
Verify that install by running xctrace. It should print help output.
If you see an error about the active developer directory, check the path
printed by xcode-select --print-path. It should look as follows:
$ xcode-select --print-path
/Applications/Xcode.app/Contents/Developer
If not, this command will reset the path:
$ sudo xcode-select --resetThis crate works on macOS 10.13+. In practice, it transparently detects and
uses the appropriate Xcode Instruments version based on your macOS version:
either /usr/bin/instruments on older macOS, or starting with macOS 10.15, the
new xcrun xctrace.
The simplest way to install is via Homebrew:
$ brew install cargo-instrumentsAlternatively, you can install from source.
First, ensure that you are running macOS, with Cargo, Xcode, and the Xcode Command Line Tools installed.
If OpenSSL is installed (e.g., via brew), then install with
$ cargo install cargo-instrumentsIf OpenSSL is not installed or if cargo install fails with an error message starting with "Could not find directory of OpenSSL installation, and this -sys crate cannot proceed without this knowledge," then install with
$ cargo install --features vendored-openssl cargo-instrumentsIf you're using nix, this command should provide all dependencies and build cargo-instruments from source:
$ nix-shell --command 'cargo install cargo-instruments' --pure -p \
	darwin.apple_sdk.frameworks.SystemConfiguration \
	darwin.apple_sdk.frameworks.CoreServices \
	rustc cargo sccache libgit2 pkg-config libiconv \
llvmPackages_13.libclang opensslcargo-instruments requires a binary target to run. By default, it will try to
build the current crate's main.rs. You can specify an alternative binary by
using the --bin or --example flags, or a benchmark target with the --bench
flag.
Assuming your crate has one binary target named mybin, and you want to profile
using the Allocations Instruments template:
Generate a new trace file (by default saved in target/instruments)
$ cargo instruments -t AllocationsOpen the trace file in Instruments.app manually
By default the trace file will immediately be opened with Instruments.app. If you do not want this behavior use the --no-open flag.
$ open target/instruments/mybin_Allocations_2021-05-09T12_34_56.traceIf there are multiple packages, you can specify the package to profile with
the --package flag.
For example, you use Cargo's workspace to manage multiple packages. To profile
the bin bar of the package foo:
$ cargo instruments --package foo --template alloc --bin barIn many cases, a package only has one binary. In this case --package behaves the
same as --bin.
When profiling the application in release mode the compiler doesn't provide debugging symbols in the default configuration.
To let the compiler generate the debugging symbols even in release mode you
can append the following section in your Cargo.toml.
[profile.release]
debug = trueAs usual, thanks to Clap, running cargo instruments -h prints the compact help.
Profile a binary with Xcode Instruments.

By default, cargo-instruments will build your main binary.

Usage: cargo instruments [OPTIONS] [ARGS]...

Arguments:
  [ARGS]...
          Arguments passed to the target binary.

          To pass flags, precede child args with `--`,
          e.g. `cargo instruments -- -t test1.txt --slow-mode`.

Options:
  -l, --list-templates             List available templates
  -t, --template <TEMPLATE>        Specify the instruments template to run
  -p, --package <NAME>             Specify package for example/bin/bench
      --example <NAME>             Example binary to run
      --bin <NAME>                 Binary to run
      --bench <NAME>               Benchmark target to run
      --release                    Pass --release to cargo
      --profile <NAME>             Pass --profile NAME to cargo
  -o, --output <PATH>              Output .trace file to the given path
      --time-limit <MILLIS>        Limit recording time to the specified value (in milliseconds)
      --no-open                    Do not open the generated trace file in Instruments.app
      --features <CARGO-FEATURES>  Features to pass to cargo
      --manifest-path <PATH>       Path to Cargo.toml
  -h, --help                       Print help (see a summary with '-h')
      --all-features               Activate all features for the selected target
      --no-default-features        Do not activate the default features for the selected target
      --no-demangle                Do not demangle Rust symbols in the profiling output

EXAMPLE:
    cargo instruments -t time    Profile main binary with the (recommended) Time Profiler.
And cargo instruments --help provides more detail.
Instruments has the concept of 'templates', which describe sets of dtrace
probes that can be enabled. You can ask cargo-instruments to list available
templates, including your custom ones (see help above). If you don't provide a
template name, you will be prompted to choose one.
Typically, the built-in templates are
built-in abbrev
---------------------------------
Activity Monitor
Allocations (alloc)
Animation Hitches
App Launch
Audio System Trace
CPU Counters
CPU Profiler (cpu)
Core ML
Data Persistence
File Activity (io)
Game Memory
Game Performance
Game Performance Overview
Leaks
Logging
Metal System Trace
Network
Power Profiler
Processor Trace
RealityKit Trace
Swift Concurrency
SwiftUI
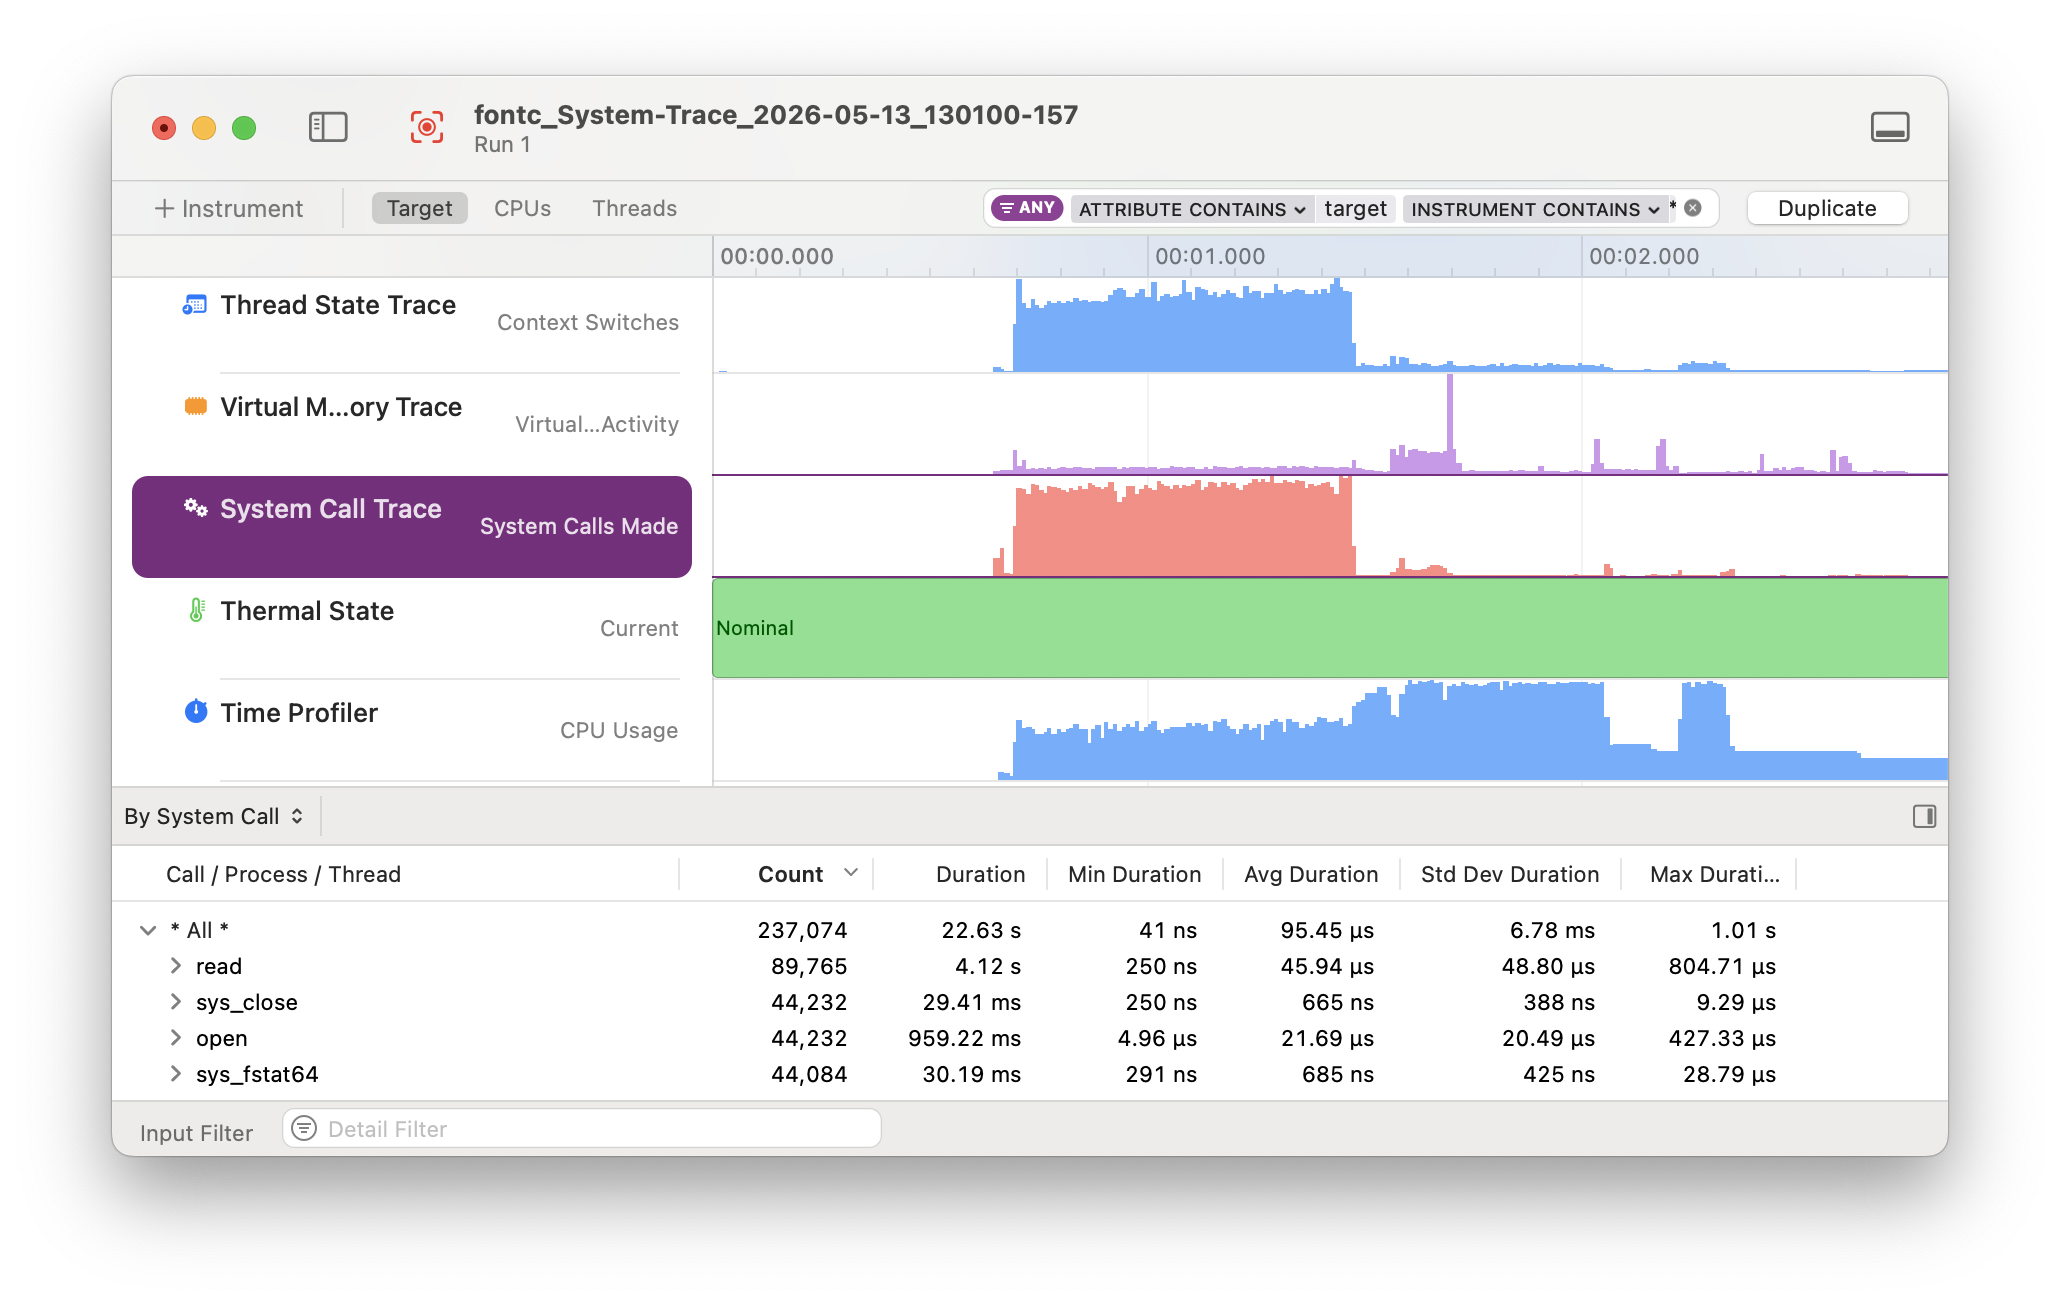
System Trace (sys)
Tailspin
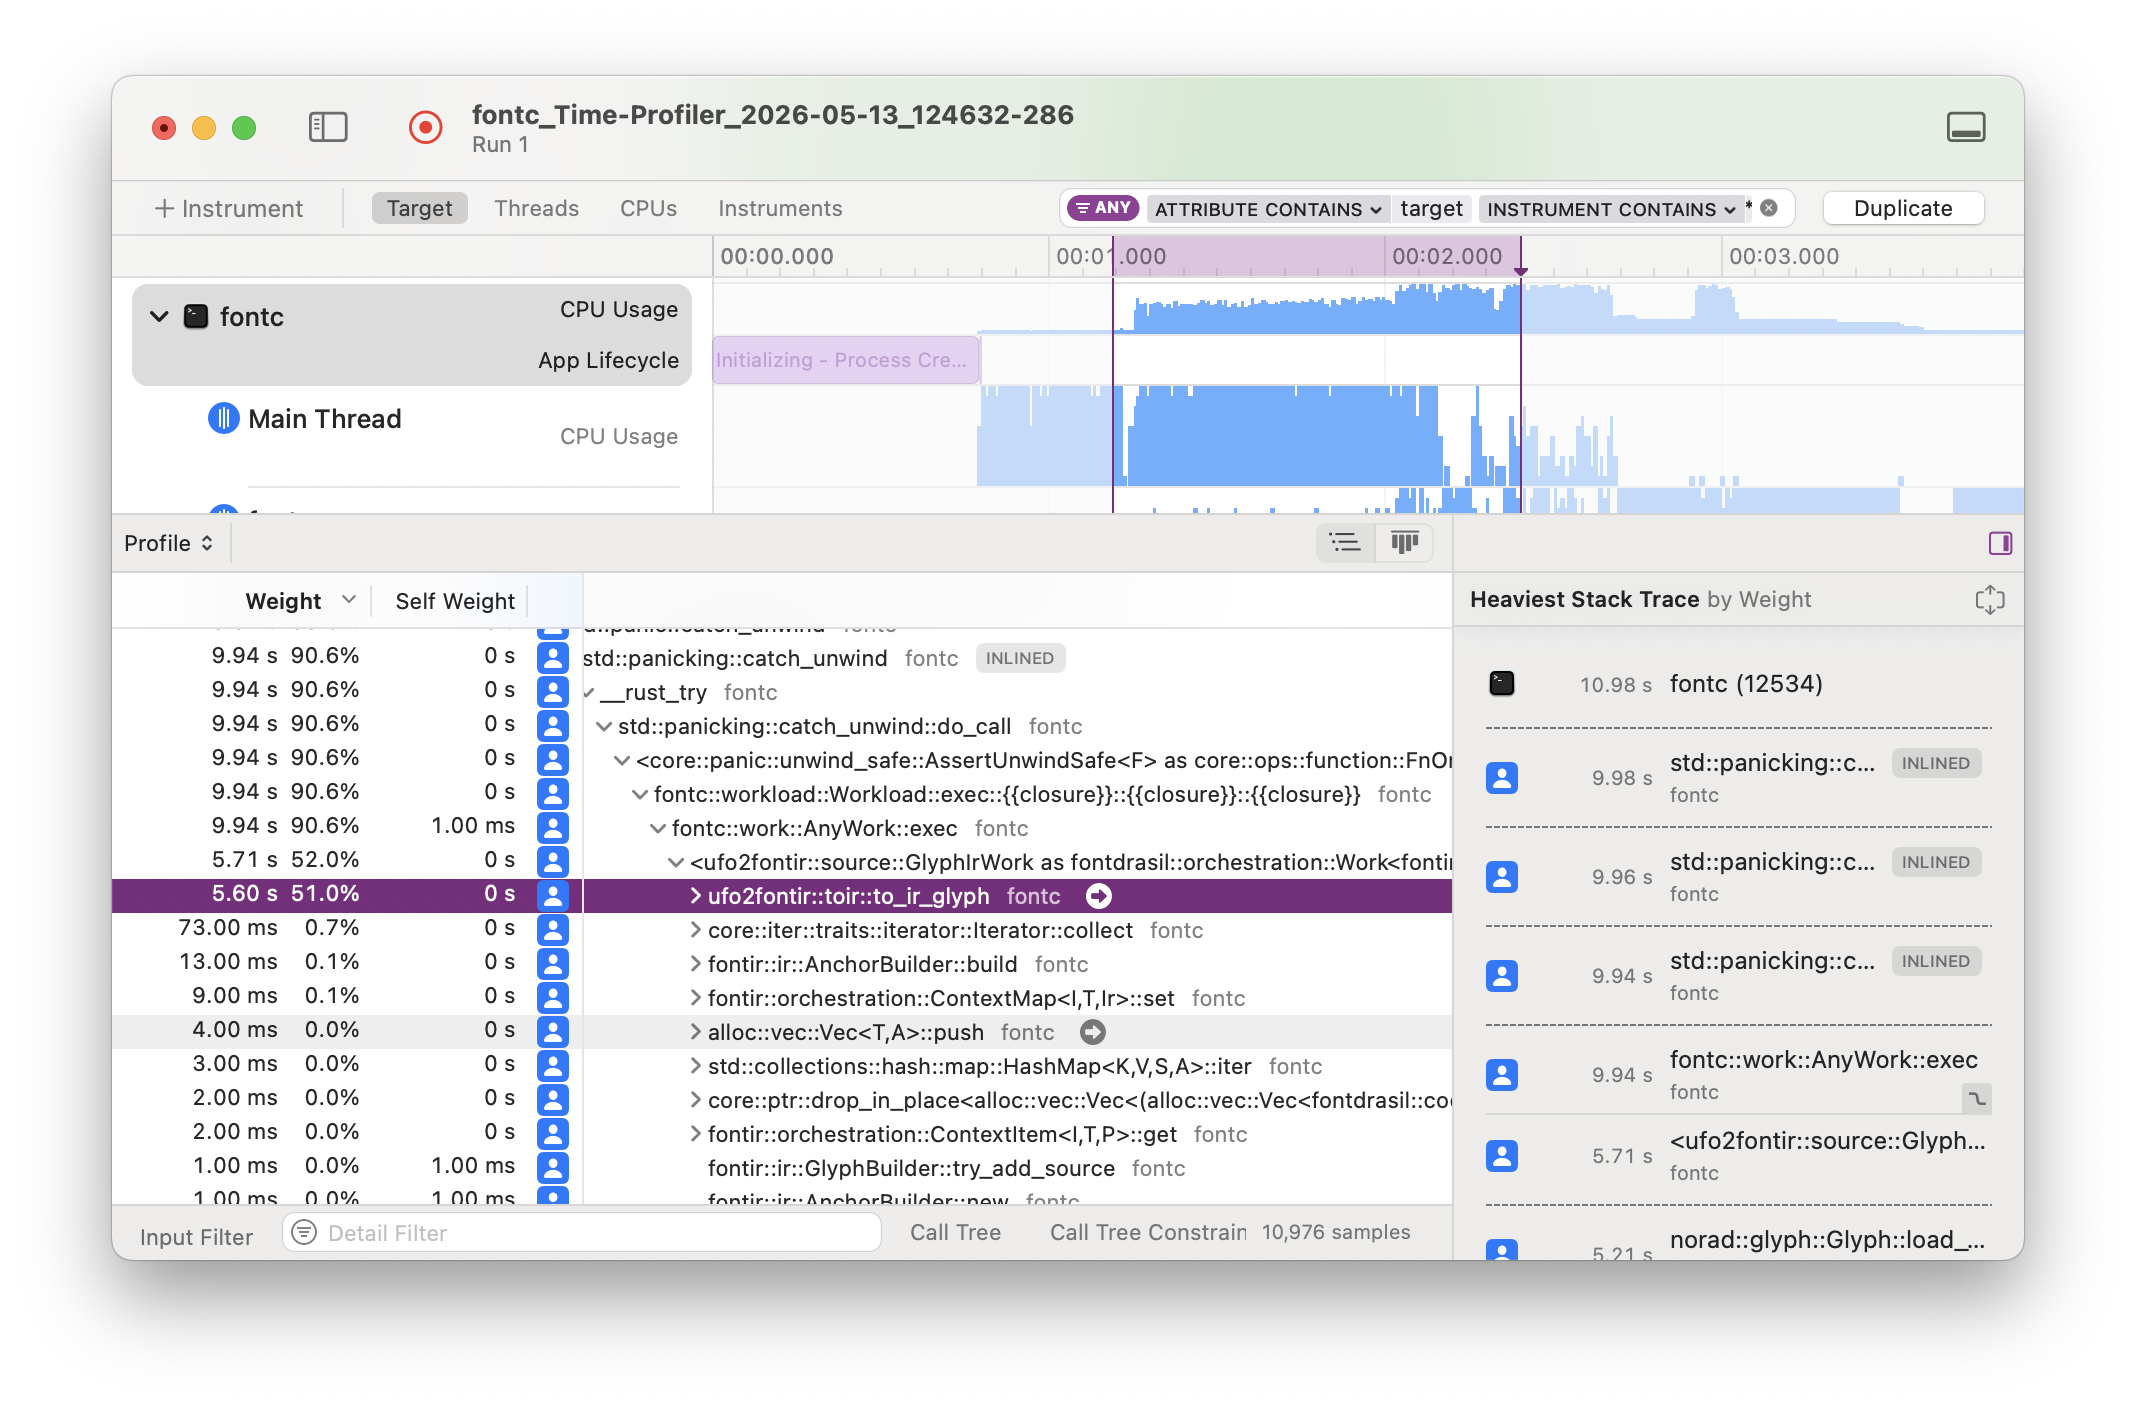
Time Profiler (time)
# View all args and options
$ cargo instruments --help
# View all built-in and custom templates
$ cargo instruments --list-templates# profile the main binary with the Allocations template
$ cargo instruments -t alloc# profile examples/my_example.rs, with the Allocations template,
# for 10 seconds, and open the trace when finished
$ cargo instruments -t Allocations --example my_example --time-limit 10000 --openThe best source of information about Instruments is likely the various WWDC sessions over the years:
- Getting Started with Instruments
- Developing a Great Profiling Experience
- Visualize and Optimize Swift Concurrency
- Track Down Hangs with Xcode and On-Device Detection
- Analyze Hangs with Instruments
- Analyze Heap Memory
- Optimize CPU Performance with Instruments
- Optimize SwiftUI Performance with Instruments